
US flight data analysis using hive
This post is about analysing 20 million rows of flight on-time/delay performance using hadoop and hive.
Knowledge required: SQL and basic hadoop(hdfs, hive) concepts
Tools required: Any host system(I’m using windows7), cloudera’s CDH 5.4.0 quickstart virtual instance
Introduction
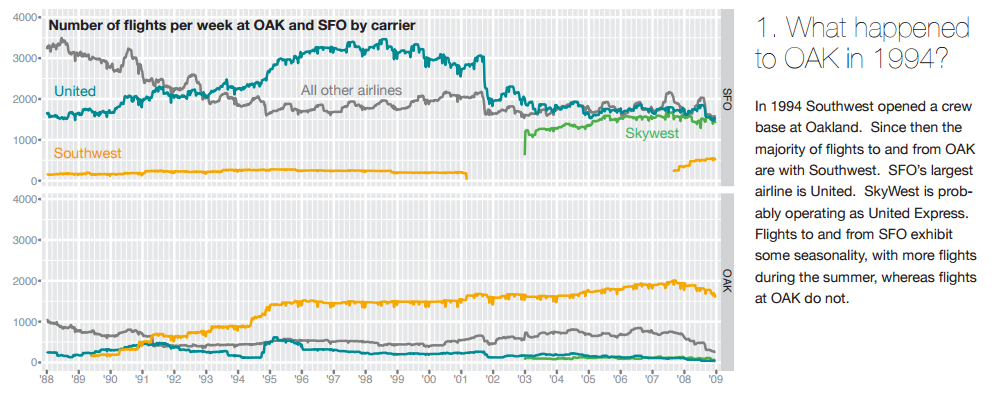
The Airline On-Time Performance Data, “contains on-time arrival data for non-stop domestic flights by major air carriers, and provides such additional items as departure and arrival delays, origin and destination airports, flight numbers, scheduled and actual departure and arrival times, cancelled or diverted flights, taxi-out and taxi-in times, air time, and non-stop distance.”
This dataset can be used to work on cool travel ideas like:
- When is the best time of day/day of week/time of year to fly to minimise delays?
- Do older planes suffer more delays?
- How does the number of people flying between different locations change over time?
- How well does weather predict plane delays?
- Can you detect cascading failures as delays in one airport create delays in others? Are there critical links in the system?
Get the flight data
we can easily get the data from here. The data is provided in the form of .csv files from year 1987 to 2008. It’s a huge dataset(2 decades old) which contains around 120 million rows of flight details and sums up to about 12GB when uncompressed. Following is the detailed description of all the variables used in the dataset.
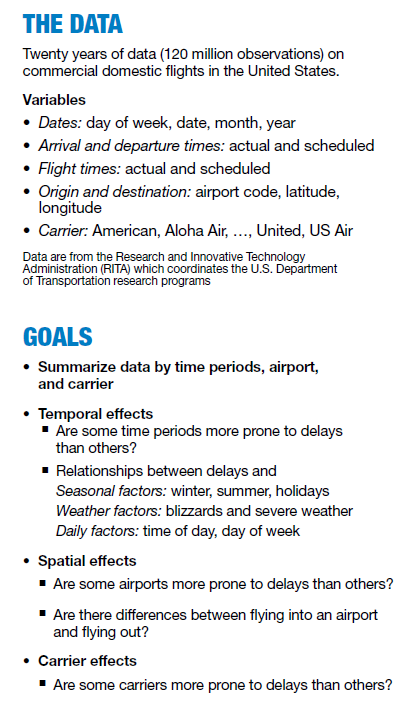
Variable descriptions
    Name : Description
1   Year : 1987-2008
2   Month : 1-12
3   DayofMonth :  1-31
4   DayOfWeek : 1 (Monday) - 7 (Sunday)
5   DepTime : actual departure time (local, hhmm)
6   CRSDepTime :  scheduled departure time (local, hhmm)
7   ArrTime : actual arrival time (local, hhmm)
8   CRSArrTime : scheduled arrival time (local, hhmm)
9   UniqueCarrier : unique carrier code
10  FlightNum : flight number
11  TailNum plane : tail number
12  ActualElapsedTime : in minutes
13  CRSElapsedTime  : in minutes
14  AirTime : in minutes
15  ArrDelay : arrival delay, in minutes
16  DepDelay : departure delay, in minutes
17  Origin : origin IATA airport code
18  Dest : destination IATA airport code
19  Distance : in miles
20  TaxiIn : taxi in time, in minutes
21  TaxiOut : taxi out time in minutes
22  Cancelled : was the flight cancelled? 0 or 1
23  CancellationCode : reason for cancellation (A = carrier, B = weather, C = NAS, D = security)
24  Diverted : 1 = yes, 0 = no
25  CarrierDelay : in minutes
26  WeatherDelay : in minutes
27  NASDelay : in minutes
28  SecurityDelay : in minutes
29  LateAircraftDelay : in minutes
Some important variables:
Time Related
month
quarter
day of month
Geography
origin
destination
Operations
delays
arrival
departure
Flight Data
carrier code
tail number
flight number
Load data in HDFS
Once we get the data, our next task is to load it in HDFS for further analysis. Currently the data is in the host OS’s file system. In order to load the data in HDFS we have to move the data from host OS to guest OS first and then from guest OS’s file-system to HDFS. To transer data from host to guest OS, we can simply create a shared folder in host OS and access it from guest OS. Now tranfer the data files from guest OS to HDFS using command line and hadoop fs commands.
// put in HDFS
$~ hadoop fs -put /local_path/file_pattern* /path/to/your/directory
// check files
$~ hadoop fs -ls /path/to/your/directory
Another easier way is upload it using HUE web GUI(from host OS).
Create table structure in hive
Now we will create a schema for the dataset and then load all the .csv files in this newly created table. In the background we are simply creating a logical table structure over the HDFS dataset using Hive. Note that at this point, only the logical structure is defined, data is still not loaded in the table. This property is called Schema on read.
“Schema-on-read” means you do not need to know how you will use your data when you are storing it. This allows you to innovate quickly by asking different and more powerful questions after storing the data.
Create External Table
Here we’re creating an external hive table, so that the same dataset can be used for other operations(pig, Hbase) as well.
CREATE EXTERNAL TABLE if not exists airlines (
Year int,
Month int,
DayofMonth int,
DayOfWeek int,
DepTime int,
CRSDepTime int,
ArrTime int,
CRSArrTime int,
UniqueCarrier string,
FlightNum int,
TailNum string,
ActualElapsedTime int,
CRSElapsedTime int,
AirTime int,
ArrDelay int,
DepDelay int,
Origin string,
Dest string,
Distance int,
TaxiIn int,
TaxiOut int,
Cancelled int,
CancellationCode string,
Diverted string,
CarrierDelay int,
WeatherDelay int,
NASDelay int,
SecurityDelay int,
LateAircraftDelay int
)
row format delimited
fields terminated by ','
lines terminated by '\n'
stored as TEXTFILE:
Describe table
Once the table structure is created we can easily view it using Hive describe clause.
1
describe airlines;
Load data in Table
Next step is to load the data in the hive table that we created.
Load data local INPATH '/user/aman/airlines_data'
OVERWRITE into TABLE airlines;
Check if data is loaded
Run a simple select/count query to check if the data is loaded correctly in the table.
// simple hive statememt to fetch top 10 records
select * from airlines limit 10;
// you can notice from the result how huge the dataset is
select count(*) from airlines;Bucketing and data sampling
We can also bucket the data using the following query or can further use these buckets to create sample data for test anaysis.
create table airlines_bucketed (
  Year int, Month int, DayofMonth int, DayOfWeek int, DepTime int, CRSDepTime int, ArrTime int, CRSArrTime int,
  UniqueCarrier string, FlightNum int, TailNum string, ActualElapsedTime int, CRSElapsedTime int, AirTime int,
  ArrDelay int, DepDelay int, Origin string, Dest string, Distance int, TaxiIn int, TaxiOut int, Cancelled int,
  CancellationCode string, Diverted string, CarrierDelay int, WeatherDelay int, NASDelay int, SecurityDelay int, LateAircraftDelay int
  )
clustered by (year) into 22 buckets
row format delimited
fields terminated by ','
TBLPROPERTIES('serialization.null.format'='', 'skip.header.line.count'='1')
from airlines
insert overwrite table airlines_bucketed
select * ;
1
2
3
4
5
// get count of each bucket
select count(*) from airlines_bucketed tablesample(bucket 1 out of 22 on year);
select count(*) from airlines_bucketed tablesample(bucket 2 out of 22 on year);
select count(*) from airlines_bucketed tablesample(bucket 3 out of 22 on year);
select count(*) from airlines_bucketed tablesample(bucket 5 out of 11 on year);
1
2
3
4
// fetching data from different buckets
select distinct Year from airlines_bucketed tablesample(bucket 1 out of 22 on year);
select distinct year from airlines_bucketed tablesample(bucket 2 out of 22 on year);
select distinct year from airlines_bucketed tablesample(bucket 5 out of 10 on year);
1
2
3
4
SELECT distinct origin
FROM airlines_bucketed tablesample(bucket 1 out of 22 on year)
WHERE dest='sfo'
ORDER BY day;
1
2
3
// block sampling
select count(*) from airlines_bucketed tablesample(10 percent);
(output count based on the number of blocks)
1
2
3
4
5
6
7
8
9
10
11
12
13
select
   min(year), max(year), uniqueCarrier, count(*) as cnt,
   sum(if(ArrDelay>30, 1, 0)) as flights_delayed,
   round(sum(if(ArrDelay>30, 1, 0))/count(*),2) as rate
FROM airlines
WHERE
   DayOfWeek not in (6,7) and Origin not in ('AK', 'HI', 'PR', 'VI')
   and Dest not in ('AK', 'HI', 'PR', 'VI')
   and year < 2010
GROUP by uniquecarrier
HAVING cnt > 100000 and max(year) > 1990
ORDER by rate DESC
LIMIT 1000;
Running ad-hoc queries using Hive
We can use Hive to answer “ad-hoc” queries at the same cost as that for generating aggregate reports. For instance: What was the worst year due to delays caused by weather in the state of Oregon? Answer is 2004, with 383 delayed flights due to weather causes
We can use this hive query to get the result: // todo
Some simple Ad-hoc queries
// aggregating all flights on the basis of year
select year,count(*) as count from airlines group by year order by year ;
// getting orgin/departure wise flight count
select origin, count(*) as TotalFlights from airlines group by origin order by year;
select dest, count(*) as TotalFlights from airlines group by dest, order by dest;
Calculating average departure delay for all flights in minutes: 9.58
1
2
3

select avg(DepDelay) from airlines;
query result: 8.17
Calculating departure delay standard deviation for all flights in minutes: 27.98
SD is a measure that is used to quantify the amount of variation or dispersion of a set of data values from its mean.
1
2
3

select stddev_pop(DepDelay) from airlines;
query result: 28.50
Count of flights with ‘SFO’ as source
1
2
3
4

select sum(f.flights) flightsfrom flight_performance f
  join origin o on (f.origin = o.origin)
where o.origin = 'SFO';
1
2

select year,sum(*) as TotalFlights from airlines where origin = 'SFO' group by year order by year;
1
2
3

// counts the flights and max delay at each airport
select airport_cd, count(*), max(delay) from airlines group by airport_cd;
average arrival delay in minutes for each U.S. certified carrier
Delayed flights performance by state: Which states have had more relative delayed flights during this time? (For convenience, we will consider a delay each flight whose departure delay in minutes is greater than two times the average: 19.16 minutes).
1
2
3

select OriginState, count(if(DepDelay > 19.16, "", NULL)), count(*), count(if(DepDelayMinutes > 19.16, "", NULL)) / count(*) as pcent_retraso
from airlines group by OriginState order by pcent_retraso desc;
ResultSet : State A: Delayed flights B: Flights A / B IL 1271765 7446363 0.17 NJ 413214 2567503 0.16 GA 934228 6012156 0.15
Delayed flights annual performance by carrier: Which flight carriers have had more relative delayed flights during this time, by year? This query shows us a “negative annual ranking” of carriers.
1
2

create table year_carrier_stats(year string, carrier string, delayed int, total int, percent double) row format delimited fields terminated by '\t' stored as textfile;
1
2
3
4
5
6
7
8
9
10
11
12
13
14
15
insert overwrite table year_carrier_stats
   select
      Year,
      Carrier,
      count(if(DepDelayMinutes > 19.16, "", NULL)),
      count(*),
      count(if(DepDelayMinutes > 19.16, "", NULL)) / count(*) as pcent_retraso
   from
      my_table
   group by
      Year,
      Carrier
   order by
      Year asc,
      pcent_retraso desc;
1
select year,count(*) as TotalFlights from airlines where origin = 'SFO' group by year order by year;
ResultSet: Year | Carrier| A: Delayed flights | B: Flights | A / B —–|——–|——————–|————| 2007 | EV | 78482 | 286234 | 0.27 2007 | AA | 134338| 633857| 0.21 2007 | MQ |110457 | 540494 | 0.20 2007 | B6 | 38695 | 191450 | 0.20 2007 | UA | 97736 | 490002 | 0.19
1
2
3
4
5
6
7
8
9
10
11
12
select
   Year,
   count(if(WeatherDelay > 0, "", NULL)) as foo
from
   my_table
where
   OriginState like '%OR%'
group by
   Year
order by
   foo desc
limit 1;
Variable correlation:
Let’s take the following hypothesis: The later in the day, the more likely it is that a flight will be delayed. Is there any relationship between arrival time and delay time of a flight?
A simple way of proving this hypothesis is through a simple query that extracts and creates groupings by arrival time, measuring the average delay time in each of the time intervals.
1
2
3
4
5
6
7
8
9
select
   substr(DepTime, 0, 2) as foo,
   avg(ArrDelayMinutes)
from
   my_table
group by
   substr(DepTime, 0, 2)
order by
   foo asc;
Indeed, the later in the day, the more delays there are, because flight delays are usually accumulative. Because flights that arrive late in the night still arrive after midnight, the early hours of the day are the ones that accumulate the most delay time.
Creating visualizations and graphs
Other questions that could be asked the same way and at the same cost: What days in the week accumulated the majority of delayed flights? Which flights are delayed the most, by company?
ToDO
- delays by year
- delay by month or week
- delay on hourly basis of a day
- busiest airports
- top cities
- When is the best time of day/day of week/time of year to fly to minimise delays?
- Do older planes suffer more delays?
- How does the number of people flying between different locations change over time?
- How well does weather predict plane delays?
- Can you detect cascading failures as delays in one airport create delays in others? Are there critical links in the system?